
profiler-md
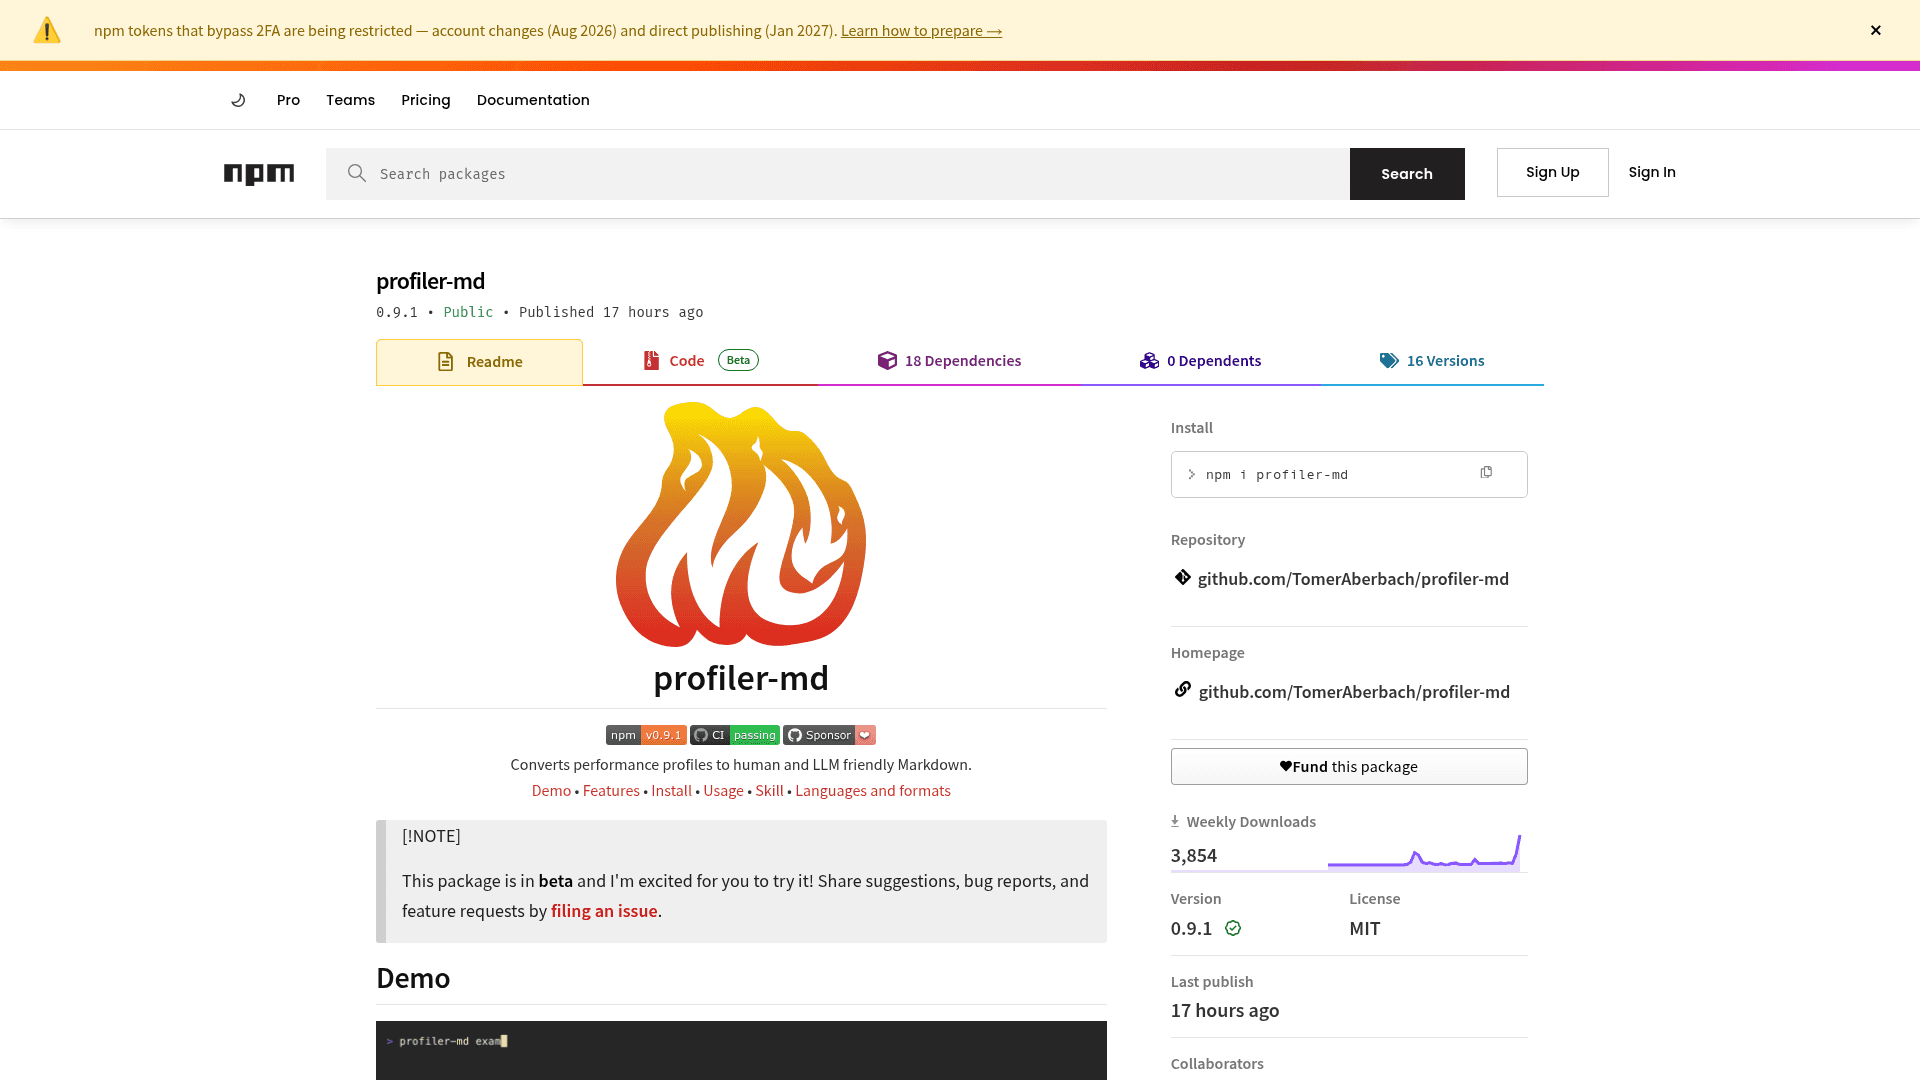
Command-line tool and API that converts performance profiles, heap snapshots, and traces into human and LLM friendly Markdown.
At a Glance
profiler-md CLI is open source under the MIT license; free to install via npm or Homebrew.
Engagement
Available On
Alternatives
Listed Nov 2026
About profiler-md
profiler-md is an open-source tool by Tomer Aberbach that converts performance profiles into Markdown that people and LLMs can read. It takes profiles, heap snapshots, and traces from many languages and profilers, and produces ranked summaries of where time and memory go. The package is in beta and is installable via npm or Homebrew.
What It Is
profiler-md is a CLI and fully-typed JavaScript API for turning raw profiler output into structured Markdown. You give it a profile file (or pipe one through stdin), and it auto-detects the format and profiler, then writes a report to the terminal or a file. It can also diff two profiles, two heap snapshots, or two traces.
What the Output Contains
For CPU profiles, the Markdown includes total time and sample counts, a category breakdown (for example third-party, garbage collector, standard library, native), a call tree to the hottest functions, and tables of the hottest functions by self time and total time, plus hottest call stacks and per-line, caller, and callee detail. Heap analysis covers self and dominator-based retained sizes, retainer paths, and the largest constructors and strings. Trace analysis covers category and thread breakdowns, longest spans, frequent instants, and gauges such as heap size over time. Diffing ranks regressions and improvements.
Languages, Formats, and Configuration
Supported formats include callgrind, collapsed stacks, GHC eventlog and JSON profile, HPROF, JFR, JSC and V8 heap snapshots, memray, perf, pprof, speedscope, systing, Trace Event Format, V8 CPU and heap profiles, and WebKit timeline recordings. Documented languages include C/C++, C#/F#, Elixir/Erlang, Fortran, Go, Haskell, Java/Kotlin/Groovy, JavaScript/TypeScript, Julia, Nix, PHP, Python, Ruby, Rust, Swift, and Zig. Options cover top-N size, base URLs, source maps, categorization rules, show/hide filters, and diff matching. A --help <language> or --help <format> explains how to generate and read each format.
Agent Workflow
The repository ships a profile-optimize skill that guides an AI agent through profiling and optimizing code by running the profiler-md CLI. It can be installed via the skills tool, or natively as a Claude Code or Codex plugin, or with Pi.
Community Discussions
Be the first to start a conversation about profiler-md
Share your experience with profiler-md, ask questions, or help others learn from your insights.
Pricing
Open Source (MIT)
profiler-md CLI is open source under the MIT license; free to install via npm or Homebrew.
- Converts performance profiles to human and LLM friendly Markdown
- Diff two profiles or heap snapshots
- Install via npm or Homebrew
- MIT License
- Currently in beta
Capabilities
Key Features
- Converts performance profiles to Markdown
- Heap snapshot analysis with retained sizes and retainer paths
- Trace analysis with spans, threads, and gauges
- Diffing of profiles, heap snapshots, and traces
- Source map resolution
- Auto-detection of format and profiler
- Configurable ranking, filtering, categorization
- CLI and typed sync/async API
- Per-language and per-format help
- Agent skill for profiling and optimization
- Shell completions