CNN Explainer
An interactive visualization system that helps non-experts learn about Convolutional Neural Networks (CNNs).
At a Glance
About CNN Explainer
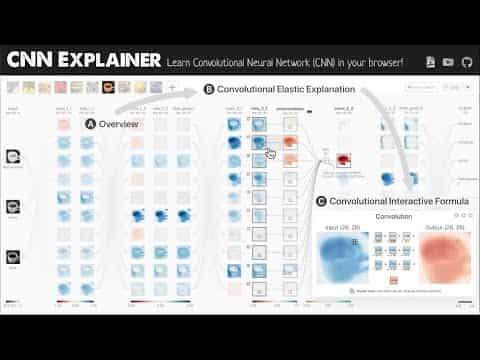
CNN Explainer is an interactive visualization system designed to help non-experts learn about Convolutional Neural Networks (CNNs). Built by the Polo Club of Data Science at Georgia Tech, it provides a hands-on way to understand how CNNs process images through each layer of the network. The tool runs entirely in the browser using a Tiny VGG model trained on image classification tasks, and the accompanying research was published in IEEE Transactions on Visualization and Computer Graphics (TVCG) in 2020.
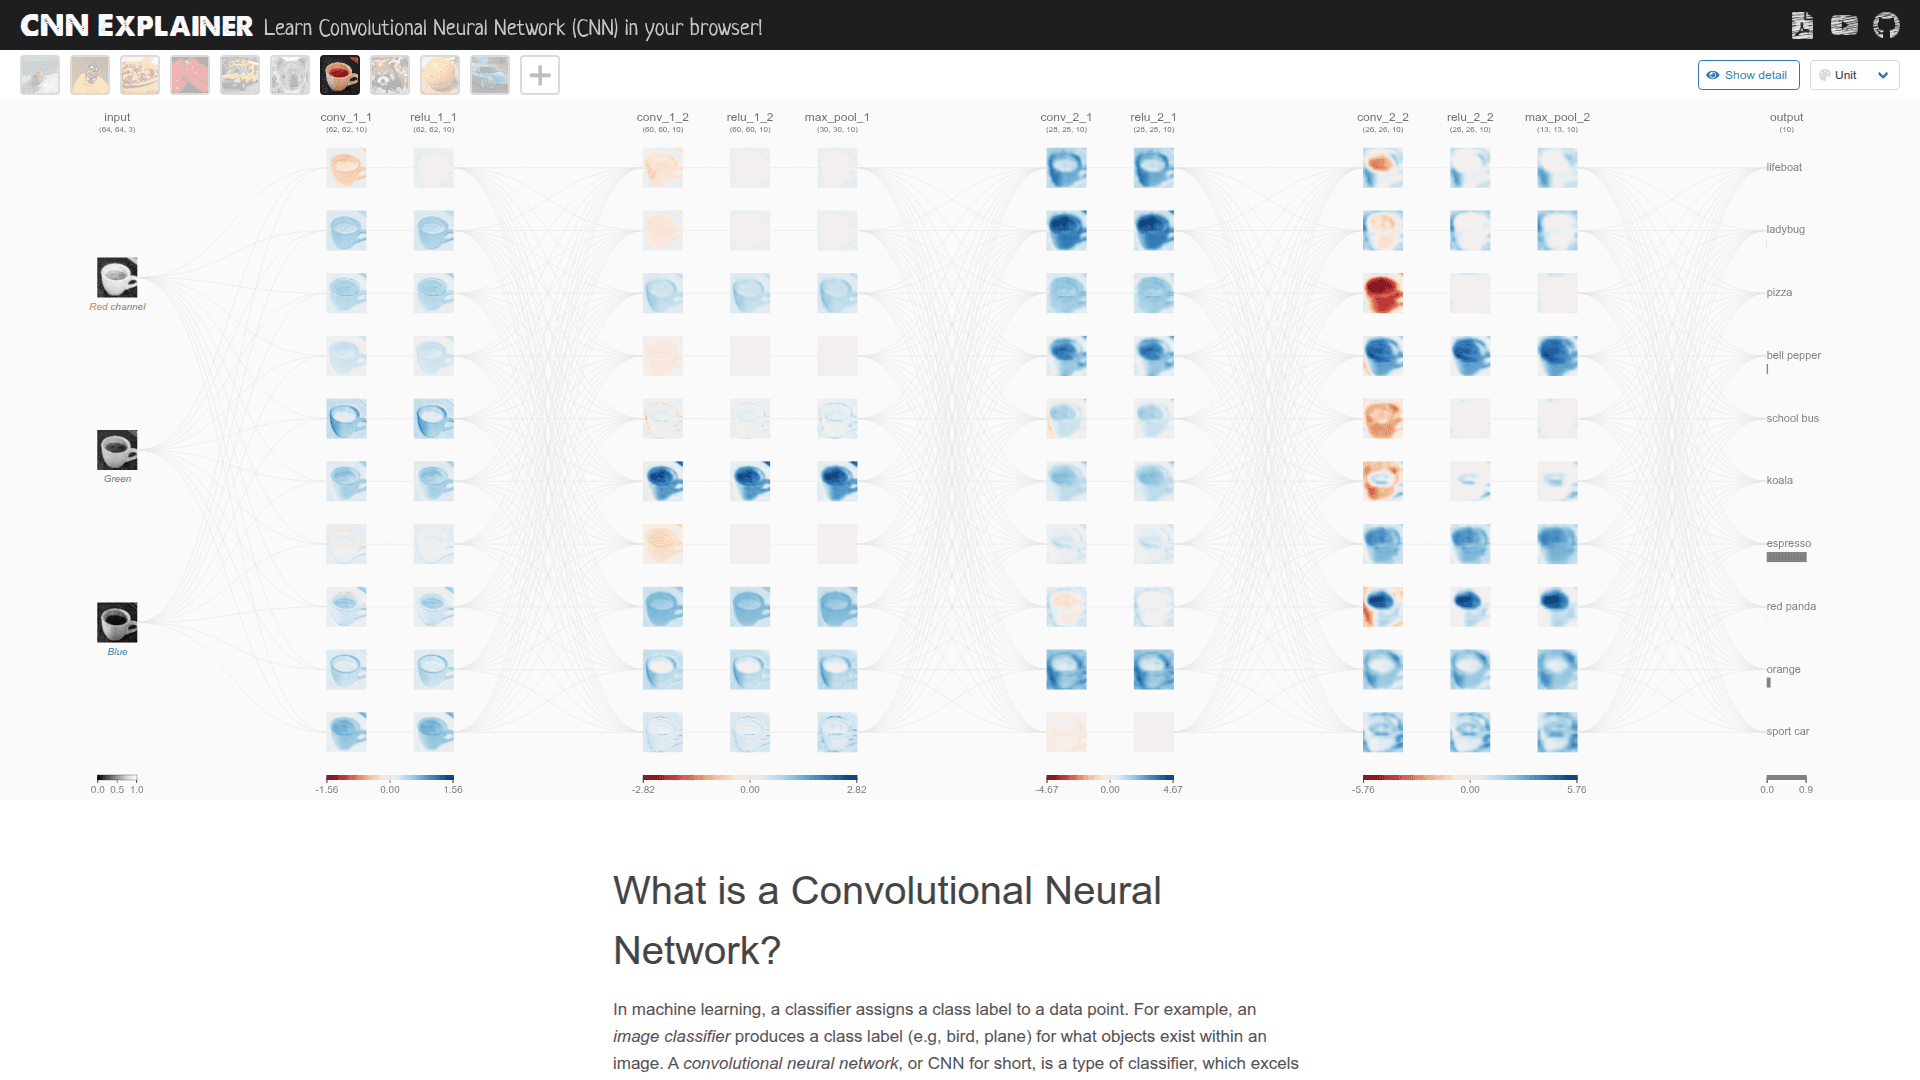
- Interactive CNN Architecture View - Explore a complete CNN architecture with clickable layers showing how data flows from input to output in real time
- Layer-by-Layer Visualization - Step through convolution, pooling, activation, and fully connected layers to see how each one transforms the input image
- Real-Time Inference - Watch the network process images live in the browser with no server required, using a pre-trained Tiny VGG model
- Filter and Activation Maps - Inspect individual convolutional filters and their resulting activation maps to understand what the network learns at each stage
- Animated Operations - View animated explanations of core CNN operations like convolution, ReLU activation, max pooling, and softmax classification
- Educational Tooltips and Annotations - Hover over any component to get plain-language explanations of what each part of the network does
- Custom Model Support - Load your own trained CNN model or image classes to explore beyond the built-in Tiny VGG example
- Open Source and Self-Hostable - Clone the repository and run locally with npm, or access the hosted version at no cost
Community Discussions
Be the first to start a conversation about CNN Explainer
Share your experience with CNN Explainer, ask questions, or help others learn from your insights.
Pricing
Free
Fully free and open source under MIT license
- Full interactive CNN visualization
- Real-time in-browser inference
- Layer-by-layer exploration
- Filter and activation map inspection
- Animated operation explanations
Capabilities
Key Features
- Interactive CNN architecture visualization
- Layer-by-layer data flow exploration
- Real-time in-browser inference with Tiny VGG model
- Convolutional filter and activation map inspection
- Animated explanations of convolution, ReLU, pooling, and softmax
- Educational tooltips and annotations for each network component
- Support for custom CNN models and image classes
- No server required — runs entirely in the browser
- Built with Svelte and JavaScript for fast rendering
- Open source under MIT license
Demo Video