
Flint Chart
A Microsoft Research visualization intermediate language that lets AI agents reliably create expressive, good-looking charts from simple, human-editable chart specs.
At a Glance
About Flint Chart
Flint is a visualization intermediate language built by Microsoft Research in collaboration with the IDEAS Lab at Renmin University of China. It bridges the gap between AI agents and chart rendering by letting agents produce compact, human-readable chart specs that a compiler then expands into fully configured, backend-native visualizations. The project is open source under the MIT license and available on npm as flint-chart and flint-chart-mcp.
What It Is
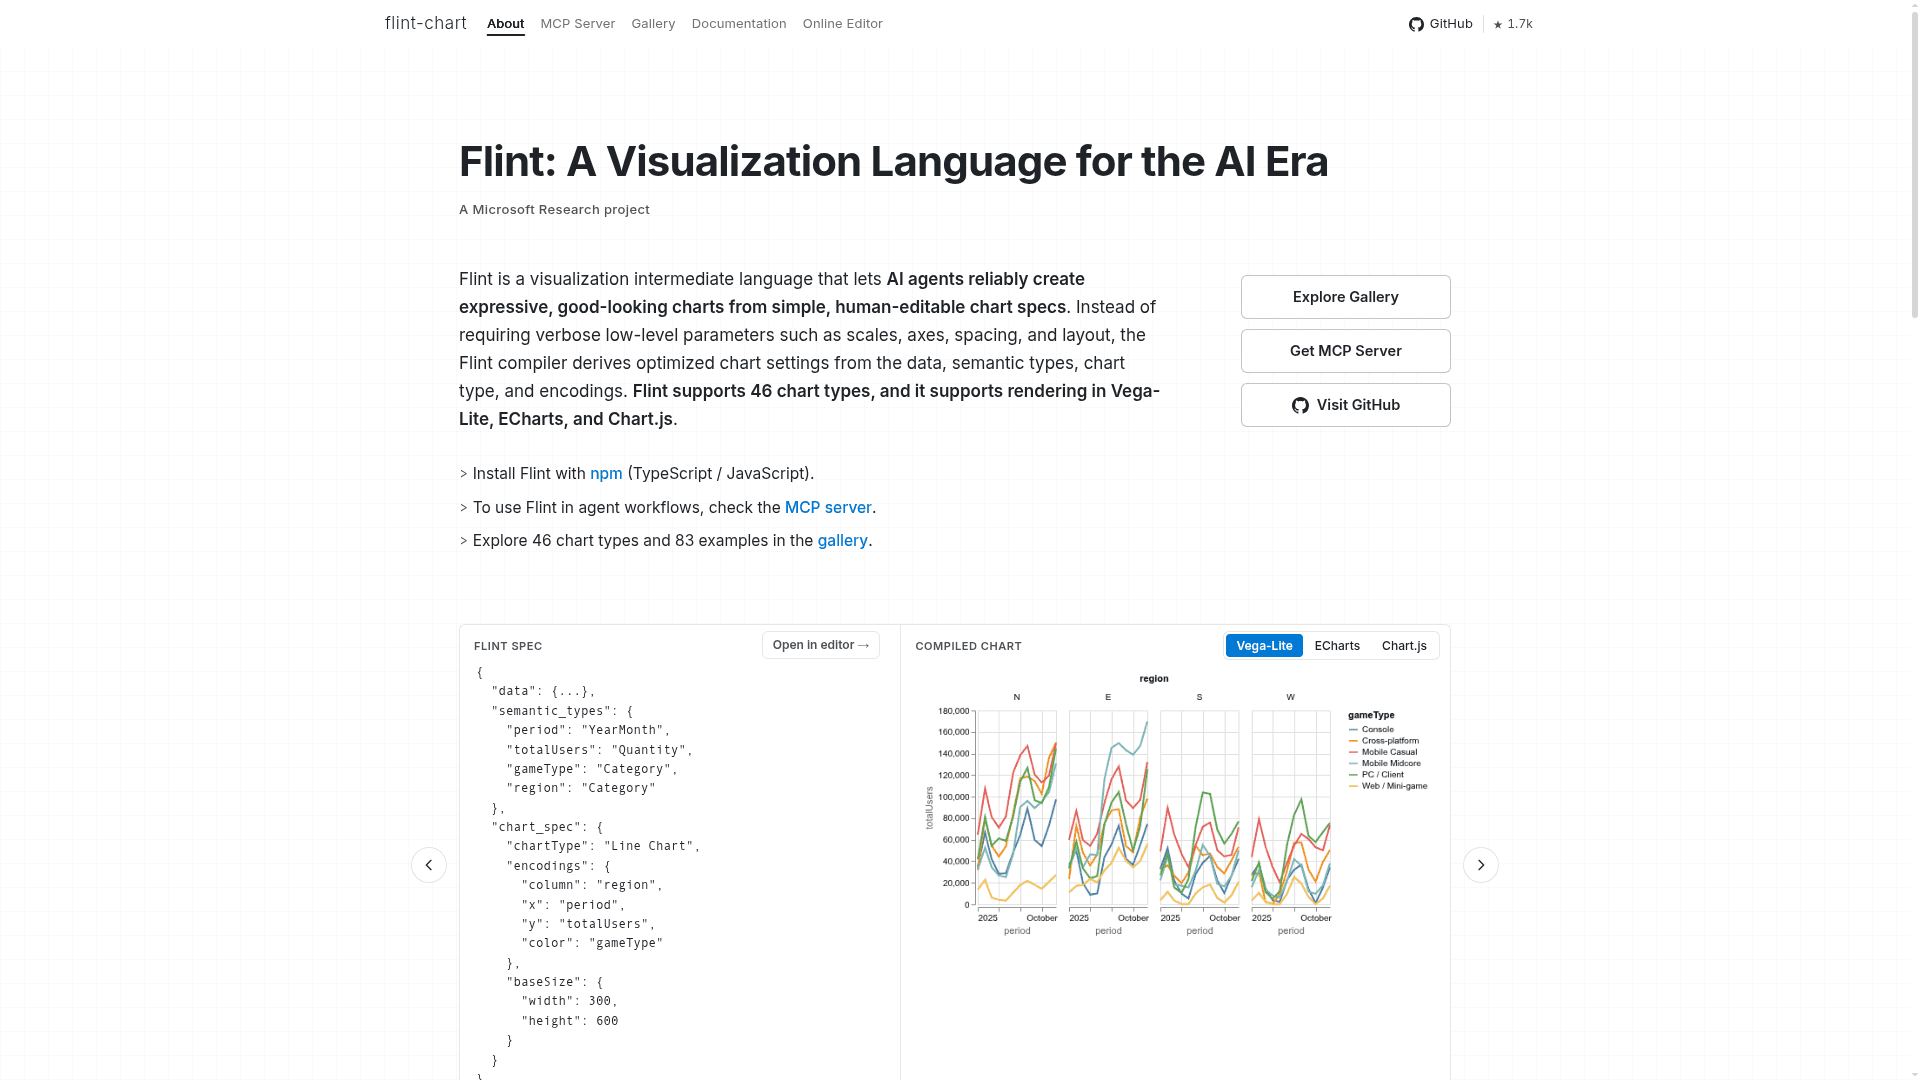
Flint sits between an AI agent (or a developer) and a charting library. Instead of requiring verbose low-level parameters — scales, axes, spacing, label formatting, color schemes — the Flint compiler derives all of those settings from the data, semantic types, chart type, and encoding declarations. The result is a compact spec that agents can generate reliably, humans can read and edit directly, and multiple rendering backends can consume without any changes to the input shape. The project homepage lists support for 46 chart types and 83 backend-specific gallery examples across Vega-Lite, ECharts, and Chart.js.
How the Compiler Works
A Flint spec has three parts: the data, a semantic_types map that labels each field with a meaning (e.g., YearMonth, Quantity, Profit, Country, Rank), and a chart_spec that names the chart type and binds fields to visual encodings. From those inputs the compiler:
- Infers temporal parsers, axis formatting, and color schemes from semantic types (70+ types supported)
- Applies an elastic layout model and banking principles to dynamically size, space, and arrange marks so charts fit the canvas at any data cardinality
- Cascades encoding changes through all low-level settings when the user switches chart type or rebinds a field
- Emits a complete, ready-to-render native spec for the chosen backend (Vega-Lite, ECharts, or Chart.js)
MCP Server and Agent Workflow
The flint-chart-mcp package exposes Flint as a Model Context Protocol server, letting agents create, validate, and render charts directly from a chat or coding environment. Agents can embed data inline as data.values or reference local JSON, CSV, or TSV files by data.url. The MCP server can open an interactive chart view, return static PNG/SVG output, or produce backend-native specs. For agent workflows without MCP, the repository also ships a standalone agent skill. The project homepage provides client configuration guides and usage examples for MCP-capable clients.
Repository Architecture
The monorepo is organized into three main packages:
flint-js— the TypeScript/JavaScript library (flint-charton npm), containing the core semantics engine, layout system, and three rendering backends (Vega-Lite, ECharts, Chart.js)flint-mcp— the MCP server package (flint-chart-mcpon npm)flint-py— a Python port preview (source-only; npm package to be released per the README)
A Vite + React demo site hosts the landing page, gallery, live editor, and concept docs. Node 18+ is required to build and run the project locally.
Update: Flint 0.2.1
The latest release is version 0.2.1 (Flint 0.2), published on July 13, 2026. The repository was created in May 2026 and has accumulated over 1,600 GitHub stars and 75 forks as of mid-July 2026, according to the GitHub metadata. A research paper describing Flint is noted in the README as forthcoming. Active CI, a changelog, and regular pushes signal ongoing development momentum.
Community Discussions
Be the first to start a conversation about Flint Chart
Share your experience with Flint Chart, ask questions, or help others learn from your insights.
Pricing
Open Source
Free and open source under the MIT license. Install via npm or clone from GitHub.
- Full flint-chart TypeScript/JavaScript library
- flint-chart-mcp MCP server
- 46 chart types across Vega-Lite, ECharts, and Chart.js
- Online editor and gallery
- MIT license — free to use, modify, and distribute
Capabilities
Key Features
- 46 chart types supported across Vega-Lite, ECharts, and Chart.js
- 70+ semantic types for field meaning inference (Rank, Temperature, Price, Country, etc.)
- Automatic layout optimization using elastic layout model and banking principles
- Compact human-editable chart specs compiled to backend-native specs
- MCP server for agent-driven chart creation and rendering
- Multi-backend rendering: Vega-Lite, ECharts, Chart.js from a single input
- Interactive online editor and gallery with 83 examples
- Static PNG/SVG output and interactive chart views via MCP
- Standalone agent skill for non-MCP agent workflows
- TypeScript/JavaScript library installable via npm
- Python port preview included in repository